04. Regular Layout
Chris Bailiss
2023-10-01
Source:vignettes/v04-regularlayout.Rmd
v04-regularlayout.RmdIn This Vignette
- Introduction
- What is Regular Layout?
- Types of Regular Layout
- Tabular Layout
- Outline Layout
- Outline Layout Settings
- Setting default outline settings
- Combined Outline Layout Example
- Multiple Level Outline Layout Example
- Outline Calculation Example
- Variable Depth Hierarchy Example
- Irregular Layout
- Further Reading
Introduction
This page defines “regular layout” then describes the two main types
of regular layout that are supported by the pivottabler
package. Most of this page is spent discussing the more advanced
“outline” layout.
What is Regular Layout?
Consider the following example pivot table:
library(pivottabler)
pt <- PivotTable$new()
pt$addData(bhmtrains)
pt$addColumnDataGroups("TrainCategory")
pt$addColumnDataGroups("PowerType")
pt$addRowDataGroups("TOC")
pt$defineCalculation(calculationName="TotalTrains", summariseExpression="n()")
pt$renderPivot()
This is a regular pivot table because each level of row and column headings is related to a single variable only, i.e.
- The first level of column headings (“Express Passenger”, “Ordinary Passenger”, etc.) are all related to the “TrainCategory” variable.
- The second level of column headings (“DMU”, “EMU”, etc.) are all related to the “PowerType” variable.
- The first level of row headings (“Arriva Trains Wales”, “CrossCountry”, etc.) are all related to the “TOC” (Train Operating Company) variable.
Types of Regular Layout
The pivottabler package supports broadly two types of
regular layout:
- Tabular Layout
- Outline Layout
These layout types can be mixed in a pivot table.
Tabular Layout
Tabular layout is the simplest pivot table layout. Where there are multiple levels of row or column data groups, then the child groups are rendered “under” the parent group. For column data groups, that is directly under the parent. For row data groups, that is to the right of the parent.
There are no additional settings for tabular layout.
The pivot table shown above is an example of a pivot table using a tabular layout. Another example of a pivot table using tabular layout is shown below.
library(pivottabler)
pt <- PivotTable$new()
pt$addData(bhmtrains)
pt$addColumnDataGroups("TrainCategory")
pt$addRowDataGroups("TOC")
pt$addRowDataGroups("PowerType")
pt$defineCalculation(calculationName="TotalTrains", summariseExpression="n()")
pt$renderPivot()
Outline Layout
Outline layout is an alternative way of rendering row data groups. Parent row data groups are rendered as headers just above the child data groups (i.e. vertically above). The last level of row data groups is not specified to use outline layout and remains using tabular layout.
Outline layout is useful when the row data group captions are longer since the text can flow to the right. Outlined row data groups act as separators in the pivot table, which can sometimes make the pivot table easier to read.
Outline layout does not apply to the column data groups - since the text for column data groups already naturally flows to the right.
Outline layout usually makes pivot tables narrower (i.e. reduced width) and longer (i.e. taller vertically).
The simplest way to enable outline layout is to specify
outlineBefore=TRUE as an argument when adding the parent
row data groups.
library(pivottabler)
pt <- PivotTable$new()
pt$addData(bhmtrains)
pt$addColumnDataGroups("TrainCategory")
pt$addRowDataGroups("TOC", outlineBefore=TRUE)
pt$addRowDataGroups("PowerType")
pt$defineCalculation(calculationName="TotalTrains", summariseExpression="n()")
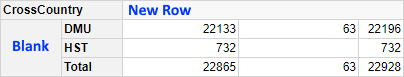
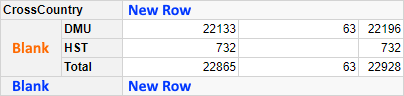
pt$renderPivot()Comparing one row data group (comprised of two levels, “TOC” and “Power Type”):
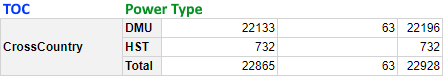
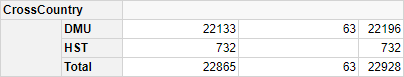
Outline layout creates a new row for TOC “CrossCountry” and makes the caption of the normal “CrossCountry” group blank.
Even though the caption is blank, this row is still applying the “TOC=CrossCountry” filtering, i.e. the numbers are the same in both the tabular layout and outline layout.
The example pivot table above uses outlineBefore=TRUE,
which adds a header row above each row data group. By default, the
caption of this data group is the data group value.
It is also possible to specify outlineAfter=TRUE. This
adds a footer row below each rowdata group. By default, the caption of
this data group is blank.
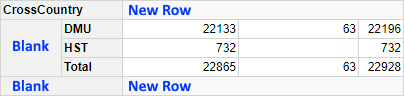
When additional variables are added to the row groups, the new rows for the outline groups are never broken down by the newly added variable, e.g. when “PowerType” was added to the example above, the two new rows were not broken down into “DMU”, “HST”, etc.
An example of a pivot table showing the outline rows before and after:
library(pivottabler)
pt <- PivotTable$new()
pt$addData(bhmtrains)
pt$addColumnDataGroups("TrainCategory")
pt$addRowDataGroups("TOC", outlineBefore=TRUE, outlineAfter=TRUE)
pt$addRowDataGroups("PowerType")
pt$defineCalculation(calculationName="TotalTrains", summariseExpression="n()")
pt$renderPivot()
Outline Layout Settings
Some aspects of the outline layout can be specifically controlled.
This is done by specifying a list of settings for the
outlineBefore, outlineAfter and/or
outlineTotal arguments.
The mergeSpace Setting
mergeSpace controls how the empty space to the right of
the outline row is merged.
doNotMerge
This specifies that nothing should be merged.
library(pivottabler)
pt <- PivotTable$new()
pt$addData(bhmtrains)
pt$addColumnDataGroups("TrainCategory")
pt$addRowDataGroups("TOC", outlineBefore=list(mergeSpace="doNotMerge"))
pt$addRowDataGroups("PowerType")
pt$defineCalculation(calculationName="TotalTrains", summariseExpression="n()")
pt$renderPivot()
dataGroupsOnly
This specifies that only the row headings should be merged.
library(pivottabler)
pt <- PivotTable$new()
pt$addData(bhmtrains)
pt$addColumnDataGroups("TrainCategory")
pt$addRowDataGroups("TOC", outlineBefore=list(mergeSpace="dataGroupsOnly"))
pt$addRowDataGroups("PowerType")
pt$defineCalculation(calculationName="TotalTrains", summariseExpression="n()")
pt$renderPivot()
cellsOnly
This specifies that only the cells should be merged.
library(pivottabler)
pt <- PivotTable$new()
pt$addData(bhmtrains)
pt$addColumnDataGroups("TrainCategory")
pt$addRowDataGroups("TOC", outlineBefore=list(mergeSpace="cellsOnly"))
pt$addRowDataGroups("PowerType")
pt$defineCalculation(calculationName="TotalTrains", summariseExpression="n()")
pt$renderPivot()
dataGroupsAndCellsAs2
This specifies that the row headings should be merged into one
combined row heading and that the cells should be merged into one cell.
This is the default used when outlineBefore=TRUE is
specified.
library(pivottabler)
pt <- PivotTable$new()
pt$addData(bhmtrains)
pt$addColumnDataGroups("TrainCategory")
pt$addRowDataGroups("TOC", outlineBefore=list(mergeSpace="dataGroupsAndCellsAs2"))
pt$addRowDataGroups("PowerType")
pt$defineCalculation(calculationName="TotalTrains", summariseExpression="n()")
pt$renderPivot()
dataGroupsAndCellsAs1
This specifies that the row headings and cells should all be merged into one.
library(pivottabler)
pt <- PivotTable$new()
pt$addData(bhmtrains)
pt$addColumnDataGroups("TrainCategory")
pt$addRowDataGroups("TOC", outlineBefore=list(mergeSpace="dataGroupsAndCellsAs1"))
pt$addRowDataGroups("PowerType")
pt$defineCalculation(calculationName="TotalTrains", summariseExpression="n()")
pt$renderPivot()
The isEmpty Setting
Normally the outline row data groups have no values in the corresponding cells in those rows in the pivot table.
Specifying isEmpty=FALSE will instead show the
corresponding calculation values in the cells of the outline rows. This
corresponds to the total of the values from the child groups. Typically,
when isEmpty=FALSE is specified for the parent row data
group, then the total rows are switched off for the child data groups by
specifying addTotal=FALSE.
library(pivottabler)
pt <- PivotTable$new()
pt$addData(bhmtrains)
pt$addColumnDataGroups("TrainCategory")
pt$addRowDataGroups("TOC",
                    outlineBefore=list(isEmpty=FALSE, mergeSpace="dataGroupsOnly"))
pt$addRowDataGroups("PowerType", addTotal=FALSE)
pt$defineCalculation(calculationName="TotalTrains", summariseExpression="n()")
pt$renderPivot()
outlineTotal=TRUE is then typically specified for the
parent row data group, so that the heading in the grand total row is
rendered in a consistent way to the rest of the outline rows (i.e. as a
merged cell, instead of separate cells).
library(pivottabler)
pt <- PivotTable$new()
pt$addData(bhmtrains)
pt$addColumnDataGroups("TrainCategory")
pt$addRowDataGroups("TOC",
                    outlineBefore=list(isEmpty=FALSE, mergeSpace="dataGroupsOnly"),
                    outlineTotal=TRUE)
pt$addRowDataGroups("PowerType", addTotal=FALSE)
pt$defineCalculation(calculationName="TotalTrains", summariseExpression="n()")
pt$renderPivot()
The caption Setting
The caption setting controls the caption shown in the outline data
group. By default the value of the caption setting is
"{value}". Changing the caption allows additional text to
be shown.
library(pivottabler)
pt <- PivotTable$new()
pt$addData(bhmtrains)
pt$addColumnDataGroups("TrainCategory")
pt$addRowDataGroups("TOC",
                    outlineBefore=list(caption="TOC:  {value}"))
pt$addRowDataGroups("PowerType")
pt$defineCalculation(calculationName="TotalTrains", summariseExpression="n()")
pt$renderPivot()
The groupStyleName and
groupStyleDeclarations Settings
The groupStyleName setting allows a new base style to be
specified for the outline groups. This will completely replace the
built-in style. A style with the corresponding name must exist in the
current pivot table theme. See the Styling vignette for more details.
In most cases specifying additional styling using the
groupStyleDeclarations setting is better since this allows
additional style declarations to be overlaid onto the base/built-in
style.
library(pivottabler)
pt <- PivotTable$new()
pt$addData(bhmtrains)
pt$addColumnDataGroups("TrainCategory")
pt$addRowDataGroups("TOC",
                    outlineBefore=list(groupStyleDeclarations=list(color="blue")))
pt$addRowDataGroups("PowerType")
pt$defineCalculation(calculationName="TotalTrains", summariseExpression="n()")
pt$renderPivot()
The cellStyleName and
cellStyleDeclarations Settings
The cellStyleName setting allows a new base style to be
specified for the cells in the outline rows. This will completely
replace the built-in style. A style with the corresponding name must
exist in the current pivot table theme. See the Styling vignette for more details.
In most cases specifying additional styling using the
cellStyleDeclarations setting is better since this allows
additional style declarations to be overlaid onto the base/built-in
style.
library(pivottabler)
pt <- PivotTable$new()
pt$addData(bhmtrains)
pt$addColumnDataGroups("TrainCategory")
pt$addRowDataGroups("TOC",
                    outlineBefore=list(mergeSpace="doNotMerge",
                                       cellStyleDeclarations=list("background-color"="lightskyblue")))
pt$addRowDataGroups("PowerType")
pt$defineCalculation(calculationName="TotalTrains", summariseExpression="n()")
pt$renderPivot()Setting default outline settings
Default values for the outlineBefore,
outlineAfter and outlineTotal parameters can
be set using pt$setDefault(). See Appendix: Details for details.
Combined Outline Layout Example
The example pivot table below combines several of the outline settings described above.
library(pivottabler)
pt <- PivotTable$new()
pt$addData(bhmtrains)
pt$addColumnDataGroups("TrainCategory")
pt$addRowDataGroups("TOC",
                    outlineBefore=list(groupStyleDeclarations=list(color="blue")),
                    outlineAfter=list(isEmpty=FALSE,
                                      mergeSpace="dataGroupsOnly",
                                      caption="Total ({value})",
                                      groupStyleDeclarations=list("font-style"="italic")),
                    outlineTotal=list(groupStyleDeclarations=list(color="blue"),
                                      cellStyleDeclarations=list("color"="blue")))
pt$addRowDataGroups("PowerType", addTotal=FALSE)
pt$defineCalculation(calculationName="TotalTrains", summariseExpression="n()")
pt$renderPivot()
Multiple Level Outline Layout Examples
The example pivot table below adds a third level on the row groups, where both the first and second levels are outlined, leaving the third level in tabular layout.
library(pivottabler)
pt <- PivotTable$new()
pt$addData(bhmtrains)
pt$addColumnDataGroups("TrainCategory")
pt$addRowDataGroups("TOC",
                    outlineBefore=list(isEmpty=FALSE,
                                       mergeSpace="dataGroupsOnly",
                                       groupStyleDeclarations=list(color="blue"),
                                       cellStyleDeclarations=list(color="blue")),
                    outlineTotal=list(groupStyleDeclarations=list(color="blue"),
                                      cellStyleDeclarations=list(color="blue")))
pt$addRowDataGroups("PowerType",
                    addTotal=FALSE,
                    outlineBefore=list(isEmpty=FALSE, mergeSpace="dataGroupsOnly"))
pt$addRowDataGroups("Status", addTotal=FALSE)
pt$defineCalculation(calculationName="TotalTrains", summariseExpression="n()")
pt$renderPivot()
Alternatively, it is possible to outline only the first level, leaving the second and third levels in tabular layout.
library(pivottabler)
pt <- PivotTable$new()
pt$addData(bhmtrains)
pt$addColumnDataGroups("TrainCategory")
pt$addRowDataGroups("TOC",
                    outlineBefore=list(isEmpty=FALSE,
                                       mergeSpace="dataGroupsOnly",
                                       groupStyleDeclarations=list(color="blue")),
                    outlineTotal=list(groupStyleDeclarations=list(color="blue")))
pt$addRowDataGroups("PowerType", addTotal=FALSE)
pt$addRowDataGroups("Status")
pt$defineCalculation(calculationName="TotalTrains", summariseExpression="n()")
pt$renderPivot()
Outline Calculation Example
It is also possible to put the calculations on rows in the pivot table and to outline the calculation groups.
Shown below is a pivot table with calculations on rows in tabular layout:
library(pivottabler)
pt <- PivotTable$new()
pt$addData(bhmtrains)
pt$addColumnDataGroups("TrainCategory")
pt$defineCalculation(calculationName="NumberOfTrains", caption="Number of Trains",
                     summariseExpression="n()")
pt$defineCalculation(calculationName="MaximumSpeedMPH", caption="Maximum Speed (MPH)",
                     summariseExpression="max(SchedSpeedMPH, na.rm=TRUE)")
pt$addRowCalculationGroups()
pt$addColumnDataGroups("PowerType")
pt$addRowDataGroups("TOC")
pt$renderPivot()
The same pivot table is shown below in outline layout. In this pivot table, the two calculations on rows are outlined:
library(pivottabler)
pt <- PivotTable$new()
pt$addData(bhmtrains)
pt$addColumnDataGroups("TrainCategory")
pt$defineCalculation(calculationName="NumberOfTrains", caption="Number of Trains",
                     summariseExpression="n()")
pt$defineCalculation(calculationName="MaximumSpeedMPH", caption="Maximum Speed (MPH)",
                     summariseExpression="max(SchedSpeedMPH, na.rm=TRUE)")
pt$addColumnDataGroups("PowerType")
pt$addRowCalculationGroups(outlineBefore=list(isEmpty=FALSE, mergeSpace="dataGroupsOnly",
                                              groupStyleDeclarations=list(color="blue"),
                                              cellStyleDeclarations=list(color="blue")))
pt$addRowDataGroups("TOC", addTotal=FALSE)
pt$renderPivot()
Variable Depth Hierarchy Example
For advanced scenarios, it is possible to control whether a data
group or outline child group is created using the following parameters
in pt$addRowCalculationGroups() and
pt$addColumnCalculationGroups():
-
onlyAddGroupIf- a character value that is used as an additional filter criteria before creating each data group. Only if some rows exist that match this filter will the data group be created. In the image below, this allows/prevents all of the rows being generated. -
onlyAddOutlineChildGroupIf- a character value that is used as additional filter criteria before creating each outline child data group. Only if some rows exist that match this filter will the child data group be created. In the image below, this allows/prevents just the middle (orange “Blank”) row being generated.
If no outline child data group is created, then some additional parameters can be specified to control how the outline before/outline after rows are styled (i.e. the top and bottom rows in the example image above). The parameters are:
-
nocgApplyOutlineStyling- a logical (TRUE/FALSE, defaultTRUE) value that specifies whether the outline styling should be applied. -
nocgGroupStyleName- a character value specifying an alternative base style name to use for the group. The named style should be defined in the pivot table theme -
nocgGroupStyleDeclarations- a list of CSS style declarations to be applied to the group. -
nocgCellStyleName- a character value specifying an alternative base style name to use for cells related to this group. The named style should be defined in the pivot table theme. -
nocgCellStyleDeclarations- a list of CSS style declarations to be applied to the cells related to this group.
For details of named styles and style declarations, see the Styling vignette.
These additional parameters are specified as part of the
outlineBefore or outlineAfter lists.
The example below demonstrates the use of
onlyAddOutlineChildGroupIf to create a balance sheet style
table with a variable number of levels in the row data groups:
df <- data.frame(
  Level1 = rep("Net entrepreneurial income", times=12),
  Level2 = c(rep("Net operating surplus", 9), rep("Interests and rents", 3)),
  Level3 = c(rep("Factor income", 8),"Compensation of employees","Paid rent",
             "Paid interest","Received interest"),
  Level4 = c(rep("Net value added", 6), rep("Taxes and subsidies", 2), rep(NA, 4)),
  Level5 = c(rep("Gross value added", 5),"Depreciation","Other taxes on production",
             "Other subsidies (non-product specific)", rep(NA, 4)),
  Level6 = c(rep("Production of the agricultural industry", 4),
             "Intermediate services", rep(NA, 7)),
  Level7 = c("Crop production","Livestock production",
             "Production of agricultural services","Other production", rep(NA, 8)),
  MaxGroupLevel = c(7,7,7,7,6,5,5,5,3,3,3,3),
  Budget2019 = c(4150.39,4739.2,625.6,325.8,-6427,-2049.3,
                 -145.4,2847.3,-1149,-221.2,-307.6,12.8),
  Actual2019 = c(3978.8,4341.1,603.7,343,-6063.9,-2079.6,
                 -136.8,2578.6,-1092.9,-203.3,-327.6,14.1),
  Budget2020 = c(4210.9,4857.7,676.6,405.8,-6299,-2086.7,
                 -145.4,2920.6,-1245,-236.5,-244.7,10.1),
  Actual2020 = c(4373.7,5307.6,693.9,408.2,-7065.3,-1985,
                 -154.2,3063,-1229.3,-268.2,-250.3,11.1)
)

# settings related to outline groups
ob <- list(isEmpty=FALSE, nocgApplyOutlineStyling=FALSE,
           nocgGroupStyleDeclarations=list("font-weight"="normal"))

library(pivottabler)
pt <- PivotTable$new()
pt$setDefault(addTotal=FALSE, outlineBefore=ob)
pt$addData(df)
pt$addRowDataGroups("Level1", outlineBefore=TRUE,
        onlyAddOutlineChildGroupIf="MaxGroupLevel>1")
pt$addRowDataGroups("Level2", outlineBefore=TRUE,
        onlyAddOutlineChildGroupIf="MaxGroupLevel>2",
        dataSortOrder="custom",
        customSortOrder=c("Net operating surplus", "Interests and rents"))
pt$addRowDataGroups("Level3", outlineBefore=TRUE,
        onlyAddOutlineChildGroupIf="MaxGroupLevel>3",
        dataSortOrder="custom",
        customSortOrder=c("Factor income", "Compensation of employees",
                          "Paid rent", "Paid interest", "Received interest"))
pt$addRowDataGroups("Level4", outlineBefore=TRUE,
        onlyAddOutlineChildGroupIf="MaxGroupLevel>4")
pt$addRowDataGroups("Level5", outlineBefore=TRUE,
        onlyAddOutlineChildGroupIf="MaxGroupLevel>5",
        dataSortOrder="custom",
        customSortOrder=c("Gross value added", "Depreciation",
                          "Other taxes on production",
                          "Other subsidies (non-product specific)"))
pt$addRowDataGroups("Level6", outlineBefore=TRUE,
        onlyAddOutlineChildGroupIf="MaxGroupLevel>6",
        dataSortOrder="custom",
        customSortOrder=c("Production of the agricultural industry",
                          "Intermediate Services"))
pt$addRowDataGroups("Level7", dataSortOrder="custom",
                    customSortOrder=c("Crop production", "Livestock production",
                    "Production of agricultural services", "Other production"),
                    styleDeclarations=list("font-weight"="normal"))
pt$defineCalculation(calculationName="Budget",
                     summariseExpression="sum(Budget2020)")
pt$defineCalculation(calculationName="Actual",
                     summariseExpression="sum(Actual2020)")
pt$defineCalculation(calculationName="Variance",
                     summariseExpression="sum(Actual2020)-sum(Budget2020)",
                     format="%.1f")
pt$evaluatePivot()

# apply the red style for negative variance
cells <- pt$findCells(calculationNames="Variance",
                      minValue=-1000, maxValue=0,
                      includeNull=FALSE, includeNA=FALSE)
pt$setStyling(cells=cells, declarations=list("color"="#9C0006"))
# apply the green style for positive variance
cells <- pt$findCells(calculationNames="Variance",
                      minValue=0, maxValue=10000,
                      includeNull=FALSE, includeNA=FALSE)
pt$setStyling(cells=cells, declarations=list("color"="#006100"))

# draw the pivot table
pt$renderPivot()
Irregular Layout
All of the pivot tables on this page have used regular layout, i.e. where each level of row or column data groups relates to only one variable. It is possible to construct custom pivot tables using irregular layout. See Irregular Layout for details.