In This Vignette
- Overview
- Basic Export (no styling)
- Styling and Formatting
- Formatting Cell Values
- Formatting Headings
- Export of NA, NaN, -Inf and Inf
- Column Widths and Row Heights
- Performance
- Styling Reference
- Further Reading
Overview
The pivottabler package can export a pivot table to an Excel file. Only Excel 2007 onwards (*.xlsx) files are supported. This export uses the openxlsx package.
This vignette starts with a basic (unformatted) export. Following this are various styled/formatted examples.
Basic Export (no styling)
Exporting a pivot table to an Excel table is reasonably straightforward:
- Create a pivot table in R using
pivottabler, - Using the openxlsx package, create a new Excel file and add a worksheet (or open an existing worksheet),
- Call the
writeToExcelWorksheetmethod on the pivot table. - Using the openxlsx package, save the workbook.
library(pivottabler)
pt <- PivotTable$new()
pt$addData(bhmtrains)
pt$addColumnDataGroups("TrainCategory")
pt$addColumnDataGroups("PowerType")
pt$addRowDataGroups("TOC")
pt$defineCalculation(calculationName="TotalTrains", summariseExpression="n()")
pt$evaluatePivot()

library(openxlsx)
wb <- createWorkbook(creator = Sys.getenv("USERNAME"))
addWorksheet(wb, "Data")
pt$writeToExcelWorksheet(wb=wb, wsName="Data",
                         topRowNumber=1, leftMostColumnNumber=1, applyStyles=FALSE)
saveWorkbook(wb, file="C:\\test.xlsx", overwrite = TRUE)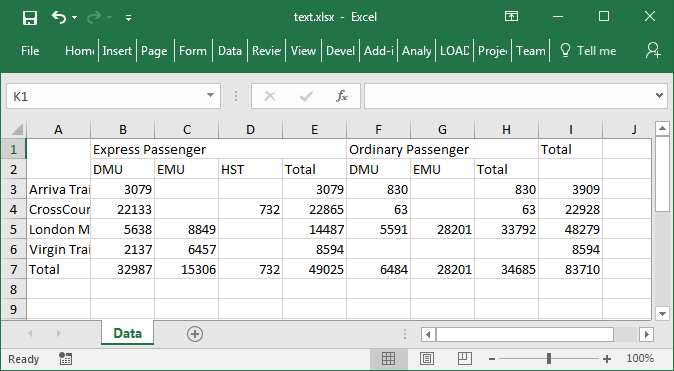
Styling and Formatting
The Excel output from the pivottabler package has been
written so that, as much as possible, the same styling used for HTML
output also works for the Excel output, i.e. most of the styling
described in the Styling vignette can
also be used when writing a pivot table to an Excel file.
More specifically, the styling described in the Styling vignette uses CSS (Cascading Style
Sheet) definitions for styles. The pivottabler package
interprets these CSS definitions and maps them to the styling used in
Excel/by the openxlsx package.
This means, once a pivot table has been styled as described in the Styling vignette, the pivot table in the
Excel workbook can be styled simply by specifying
applyStyles=TRUE.
library(pivottabler)
pt <- PivotTable$new()
pt$addData(bhmtrains)
pt$addColumnDataGroups("TrainCategory")
pt$addColumnDataGroups("PowerType")
pt$addRowDataGroups("TOC")
pt$defineCalculation(calculationName="TotalTrains", summariseExpression="n()")
pt$evaluatePivot()

library(openxlsx)
wb <- createWorkbook(creator = Sys.getenv("USERNAME"))
addWorksheet(wb, "Data")
pt$writeToExcelWorksheet(wb=wb, wsName="Data",
                         topRowNumber=1, leftMostColumnNumber=1,
                         applyStyles=TRUE, mapStylesFromCSS=TRUE)
saveWorkbook(wb, file="C:\\test.xlsx", overwrite = TRUE)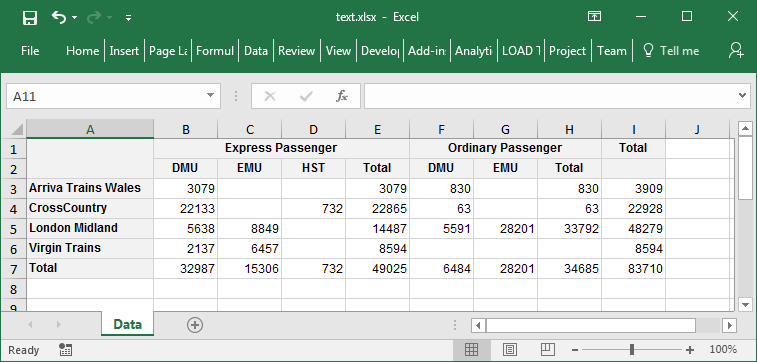
In general, the CSS mappings described above will simplify outputting
to Excel. However, not all CSS definitions can be mapped to Excel. Excel
also has some style settings that don’t map to CSS. There may also be
occasions where different styling is desired in Excel vs. HTML. To
support all of these scenarios, a second set of styling properties are
also supported. These all begin with “xl-” and have roughly similar (but
not exactly the same) names to their CSS counterparts, e.g. the property
corresponding to CSS “font-family” is “xl-font-name”. If both the “xl-…”
Excel property and the CSS property are specified, the Excel value is
used. If mapStylesFromCSS=FALSE is specified, then the CSS
properties are ignored and only the “xl-…” properties are used.
The table at the bottom of this vignette details the full set of CSS and Excel style properties that are supported.
Formatting Cell Values
There are a few different ways for format the values written into the
worksheet. These are controlled by the outputValuesAs
parameter, which has allowed values: “rawValue”, “formattedValueAsText”
and “formattedValueAsNumber”.
The following pivot table will be used to illustrate the different values for this parameter:
library(pivottabler)
library(dplyr)
library(lubridate)

# derive some additional data
trains <- mutate(bhmtrains,
   ArrivalDelta=difftime(ActualArrival, GbttArrival, units="mins"),
   ArrivalDelay=ifelse(ArrivalDelta<0, 0, ArrivalDelta))

# create the pivot table
pt <- PivotTable$new()
pt$addData(trains)
pt$addColumnDataGroups("TrainCategory")
pt$addColumnDataGroups("PowerType")
pt$addRowDataGroups("TOC", totalCaption="All TOCs")
pt$defineCalculation(calculationName="MeanArrivalDelay", caption="Mean Arr. Delay",
                     summariseExpression="mean(ArrivalDelay, na.rm=TRUE)", format="%.1f")
pt$renderPivot()
Raw Value
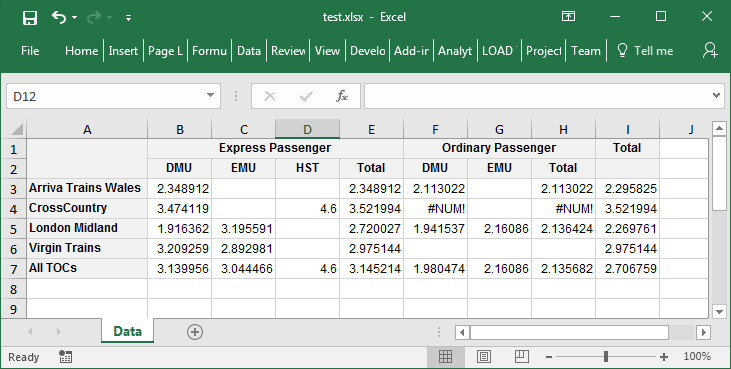
Specifying outputValuesAs="rawValue" will output the raw
unformatted values. This is also the default if no value is explicitly
specified for the outputValuesAs parameter.
library(pivottabler)
library(dplyr)
library(lubridate)

# derive some additional data
trains <- mutate(bhmtrains,
   ArrivalDelta=difftime(ActualArrival, GbttArrival, units="mins"),
   ArrivalDelay=ifelse(ArrivalDelta<0, 0, ArrivalDelta))

# create the pivot table
pt <- PivotTable$new()
pt$addData(trains)
pt$addColumnDataGroups("TrainCategory")
pt$addColumnDataGroups("PowerType")
pt$addRowDataGroups("TOC", totalCaption="All TOCs")
pt$defineCalculation(calculationName="MeanArrivalDelay", caption="Mean Arr. Delay",
                     summariseExpression="mean(ArrivalDelay, na.rm=TRUE)", format="%.1f")
pt$evaluatePivot()

library(openxlsx)
wb <- createWorkbook(creator = Sys.getenv("USERNAME"))
addWorksheet(wb, "Data")
pt$writeToExcelWorksheet(wb=wb, wsName="Data",
                         topRowNumber=1, leftMostColumnNumber=1,
                         outputValuesAs="rawValue",
                         applyStyles=TRUE, mapStylesFromCSS=TRUE)
saveWorkbook(wb, file="C:\\test.xlsx", overwrite = TRUE)
Rounding the values as part of the calculation definition is one
option that could be used with
outputValuesAs="rawValue".
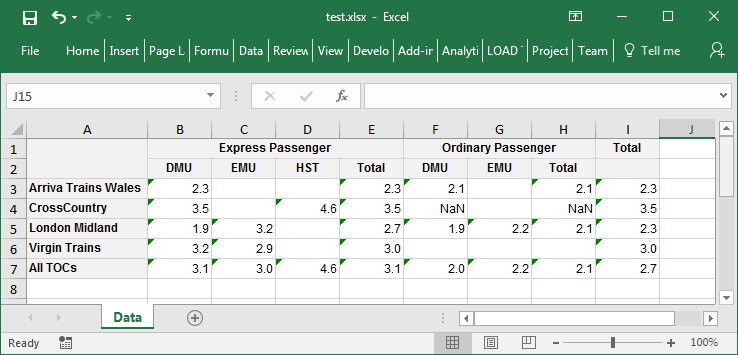
Formatted Values (as text)
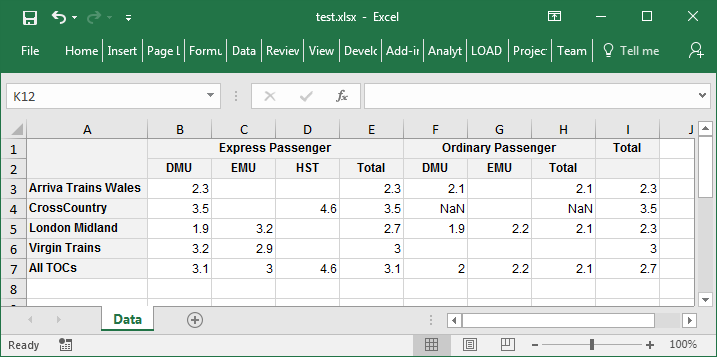
Specifying outputValuesAs="formattedValueAsText" will
output the formatted values - i.e. the calculation results that have
been formatted according to the format parameter in the
defineCalculation() function. The formatted values are text
however, so when exported to Excel this typically results in a warning
in the corner of each cell that the number in the cell has been stored
as text:
Formatted Values (as numbers)
Specifying outputValuesAs="formattedValueAsNumber" will
output the formatted values as numbers - i.e. the same values as shown
in the screen shot above, but converted back to numerical values (where
possible) - so eliminating the warnings shown above:
Using Excel to format the values (recommended)
The outputValuesAs parameter provides a simple way to
control value formatting. However, this applies to every cell in the
pivot table, so is not a very fine-grained control.
A better option is to output the raw unformatted values to Excel and then specify an Excel format string as part of the calculation definition to allow Excel to format the values.
library(pivottabler)
library(dplyr)
library(lubridate)

# derive some additional data
trains <- mutate(bhmtrains,
   ArrivalDelta=difftime(ActualArrival, GbttArrival, units="mins"),
   ArrivalDelay=ifelse(ArrivalDelta<0, 0, ArrivalDelta))

# create the pivot table
pt <- PivotTable$new()
pt$addData(trains)
pt$addColumnDataGroups("TrainCategory")
pt$addColumnDataGroups("PowerType")
pt$addRowDataGroups("TOC", totalCaption="All TOCs")
pt$defineCalculation(calculationName="MeanArrivalDelay", caption="Mean Arr. Delay",
                     summariseExpression="mean(ArrivalDelay, na.rm=TRUE)", format="%.1f",
                     cellStyleDeclarations=list("xl-value-format"="##0.0"))
pt$evaluatePivot()

library(openxlsx)
wb <- createWorkbook(creator = Sys.getenv("USERNAME"))
addWorksheet(wb, "Data")
pt$writeToExcelWorksheet(wb=wb, wsName="Data",
                         topRowNumber=1, leftMostColumnNumber=1,
                         outputValuesAs="rawValue",
                         applyStyles=TRUE, mapStylesFromCSS=TRUE)
saveWorkbook(wb, file="C:\\test.xlsx", overwrite = TRUE)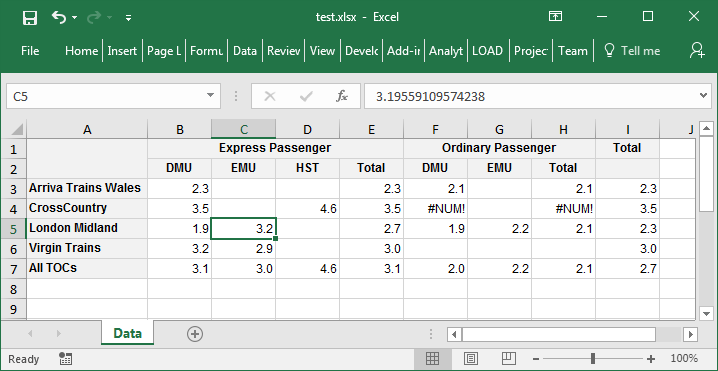
Formatting Headings
The formatting of headings is controlled by the
outputHeadingsAs parameter, which has allowed values:
“rawValue”, “formattedValueAsText” and “formattedValueAsNumber”. The
values have the same behaviour as described above for the
outputValuesAs parameter. The default value of
outputHeadingsAs is “formattedValueAsText”.
Note that specifying outputHeadingsAs="rawValue" will
export dates and POSIXct values as numbers (since dates and date/time
values are actually represented as numbers in Excel). For numbers, dates
and date/time values, specifying an Excel format code when adding the
data groups to the pivot table is recommended,
e.g. pt$addColumnDataGroups("GbttDate", styleDeclarations=list("xl-value-format"="##0.0")).
This will then ensure they are formatted when exported to Excel using
outputHeadingsAs="rawValue".
Export of NA, NaN, -Inf and Inf
The pt$writeToExcelWorksheet(...) function supports an
exportOptions parameter that provides control over how NA,
NaN, -Inf and Inf values in R are exported to Excel. See the Appendix: Details vignette for details.
Column Widths and Row Heights
It is possible to specifying a minimum row height and/or column width as part of the styling. The relevant styling properties are “xl-min-row-height” and “xl-min-column-width”.
Rows/columns are sized to meet all of the minimum sizes specified. E.g. if three cells in the same row have minimum row heights of 40, 45 and 50 specified, the row height will be set to 50.
Performance
Creating Excel files is relatively effort intensive. Outputting pivot tables to Excel files requires more time than creating a HTML representation of a pivot table. In order of increasing time required:
- Unstyled Pivot Tables - these will be written to Excel quicker than styled pivot tables.
- Pivot tables using only base styles - i.e. where no additional styles have been applied to individual cells in the pivot table - these take a moderate amount of time to write to Excel.
- Pivot tables with styles applied to individual cells - these take the longest amount of time to write to Excel due to the extra effort of handling the styles applied to individual cells.
Styling Reference
A reference table of the supported styling declarations can be found in the Appendix: Details vignette.